How to Optimize Site Performance (and Increase Search Ranking)
Quality website performance has always had a measurable impact on the online user experience. But it’s not been a top ranking factor for search engines – until now.
This month, Google is introducing new user experience metrics called Core Web Vitals, which will incorporate a webpage’s speed and performance as ranking signals. The motive is to put the best performing content front-and-center for their users.
A major algorithm update of this kind will undoubtedly shuffle SEO rankings across the board, especially for poorly performing or otherwise heavy websites who have yet to consider CWVs. Google pre-announced the update almost a year ago in an effort to give website owners and developers plenty of time to make the necessary performance changes before the official deployment.
In this article, we’ll look at the best tools to get started optimizing your WordPress website today so business goes uninterrupted moving forward.
Why the Shift to Core Web Vitals?
There is a measurable connection between website performance and transactional conversion rates, whether that means a user is actually making a purchase or not. And Google’s study from 2017 found 53% of mobile users will abandon a page if it takes longer than three seconds to load. Essentially, not meeting performance standards could mean losing half of your audience before they even view any of your content – and that’s precisely the point.
Google inherently relies on developers to not only be aware of upcoming changes, but to also perform the optimizations needed to improve CWV scores across the web.
A Closer Look at the Three Core Web Vitals
Briefly, Core Web Vitals are the new-to-the-mix performance metrics analyzing how long it takes a website to load, become interactive, and visually stabilize for the user. Keep in mind that mobile and desktop experiences are each measured separately due to the dramatic differences in formatting, data speeds, and processing power.
- Largest Contentful Paint (LCP) – Measures the loading time of the largest content on a page. This metric shows the user the page is relevant, useful, and healthy. A fast LCP is <2.5 seconds.
- First Input Delay (FID) – Measures the time from a user’s first interaction with a page to when the browser actually processes and responds to the interaction. A well-designed page has an FID of <100 milliseconds.
- Cumulative Layout Shift (CLS) – A layout shift occurs when a visual element changes its position on the page and shifts up or down. This metric measures the total number of unexpected layout shifts occurring on a page. A good CLS score is <0.1.
As part of a future update, Google has promised to award websites in the top brackets of user experience with a visual badge to make it even easier for browsers to choose the page with the best information, as well as the best experience.
Reading Red Flags on Your Performance Benchmarking Reports
Google’s recommendations for performance testing tools fall anywhere among the free suggestions below. Each will provide detailed, actionable reports so you can launch specific efforts to improve web performance. As you’re examining your various test results, any items listed in red will be your highest priority, followed by anything in orange.
- Google’s PageSpeed Insights – Entering a URL will get you a detailed analysis of everything hindering your site’s performance for desktop and mobile users, and also include recommendations on how to fix each issue. (Pro Tip: Don’t focus on reaching a perfect 100/100 here since so many other ranking factors still exist outside of CWVs.)
- Pingdom – Another full, website monitoring service that includes transaction and server monitoring in addition to page speed analysis. Of these 3 tools, Pingdom is the least granular, at least when it comes to defining action items.
- GTmetrix – The performance grade is a 70/30 split of how fast your page performs and how well it’s built for optimal performance, respectively. Red flags will be easiest to identify with their tools.
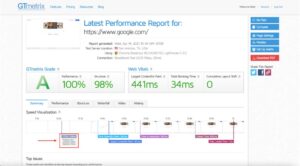
I’d like to specifically use GTmetrix for demonstrating how to examine performance results since its red flags are the easiest to identify. We’ll use the results for Google.com as a jumping off point. Again, the objective is to analyze the results with Core Web Vitals in mind.
Summary and TTFB
The overall letter score as well as a few details of your CWVs will already be in view when you first view your performance results summary.
From the speed visualization timeline, look specifically at TTFB, or time to first byte. This measurement in milliseconds measures the amount of time to create a connection to the server from the initial user request and content download. A red flag time for TTFB would be >500ms. Addressing slowness in this category will improve First Input Delay (FID) vitals.
A common solution for slow servers is to implement a Content Delivery Network (CDN), which connects a network of servers at the edge of your current hosting service. As a result, users experience much faster load times and bounce times are drastically reduced.
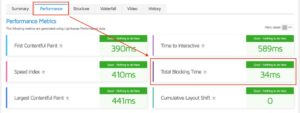
Performance
The next tab over is the Performance Report where you want to examine the ‘total blocking time.’ This measures how much time is blocked by scripts during the page loading process. It’s one of the most common red flag issues for WordPress websites. A great user experience would be <150 ms.
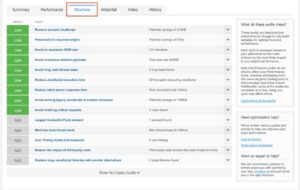
Structure
Here, you can view the real, nitty gritty of every single action item GTmetrix has identified. Use the drop down arrows to expand even more on the recommendations for each item.
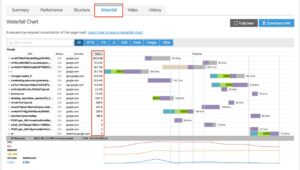
Waterfall
The Waterfall report provides great visualization of your heaviest items – those causing your site to load slower. Pro Tip: Sort the table according to size to quickly prioritize the biggest issues. While there aren’t any red flag items in the example below, any high priority items will be listed in red or orange like the rest of the GTmetrix reports.
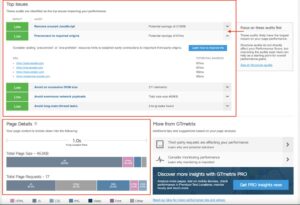
Top Issues and Page Details
These reports are the most important and immediate information you can follow for better web performance. Obviously, the Top Issues for Google are zero to none, but you may have items in bright red or orange appear here.
Just below your top issues are the Page Details results which report the amount of time it takes for any page to load completely. Your highest priorities will be total page size and total page requests. Generally speaking, the ideal page size is around 200k, and the total page requests should be less than 50.
Do not be discouraged if any of these page benchmarks don’t look great. The proper tools exist to help you combat both image and code minification, as well as the other red and orange flags you’ve spotted thus far. Let’s dive in.
Recommended Plugin-Based Solutions
Any good developer knows the value of a good plugin, and these are some of the best in the business relative to page weight for web performance. These recommendations are the off-the-shelf, DIY solutions for website owners and developers alike.
WP Smush (and WP Smush Pro)
This plugin is number one in image optimization, an area which can have massive benefits on your overall page weight and load time. There is both a free and paid version, for $5/month after a free trial. In the humble opinion of a 10+ year WordPress developer, I use Pro on my own website, and it’s worth every penny.
Both versions run automatically for all your future image uploads, but the Pro version includes upgraded features like lazy-loading and even its own CDN. When up against a handful of other popular image compression plugins, Smush Pro has proved to be the most effective way in reducing overall page weight without compromising image quality. Its CDN feature doesn’t exactly compare to dedicated CDN providers. However, image optimization belongs exclusively to Smush Pro.
WP Rocket
When it comes to reducing total http page request and blocking time, this plugin is your best friend. Its CSS and JavaScript combination and deferment tools are second to none. A single website license costs $49, but it’s one of the fastest ways to improve performance scores with its aggressive caching features and code combination/minification tools.
The only catch is this plugin doesn’t fit like a glove with every WordPress environment, particularly those with more than a handful of other active plugins installed. If you do run into compatibility issues, simply deactivate WP Rocket, and consult a WordPress expert for help. You may just need a quick CSS/JS exclusion rule for this plugin to play friendly with your website.
Disable Cart Fragments (for Ecommerce Only)
Users typically hold ecommerce websites to even higher performance standards and have very little understanding for slow shopping experiences. The ideal load times for transactional-types of pages is less than 2 seconds. The faster your page loads, the more likely a user is to perform the targeted action on that page.
Disable Cart Fragments is a lightweight plugin which speeds up your WooCommerce website by disabling the cart fragments script – which uses uncached AJAX requests to allow shopping carts to update without refreshing the page.
Errors and slow performance on WooCommerce websites are largely caused by a high number of AJAX requests, which slow down and break caching on pages that don’t actually require cart information – basically any static page or post with no ecommerce functionality.
The Disable Cart Fragments plugin does exactly as it promises and then re-enables the script once items have been added to the cart. This plugin allows you to use your existing caching plugin (WP Rocket) and still get real-time, updated cart totals by using WooCommerce cart cookies, free of slow AJAX requests.
Always keep in mind that if any of your performance results revealed more complicated issues than DIY plugins can resolve, please skip this step for now and consult a WordPress expert for help. You have a great headstart with your performance results in-hand.
Conclusion
Your search rankings will increasingly reflect how performance-focused your website actually is.
Use the resources above to find out how your website currently holds up against the new CWVs, and how far you have to go for optimum performance for the Page Experience update. The time is now to ensure you’re providing the fastest user experience.